
学習目標
この回が終わる頃には、以下のことができるようになります:
- tabular環境を使って基本的な表を作成できる
- table環境を使って表を適切に管理できる
- 表にキャプションを付けて参照できる
- セルの結合を使って複雑な表を作成できる
1. 前回の復習
画像挿入の確認
\documentclass[uplatex]{jsarticle}
\usepackage[utf8]{inputenc}
\usepackage{amsmath,amssymb}
\usepackage[dvipdfmx]{graphicx}

\begin{document}

\section{画像の復習}

\begin{figure}[h]
\centering
\includegraphics[width=0.6\textwidth]{sample.jpg}
\caption{サンプル画像}
\label{sample123}
\end{figure}

図\ref{fig:sample}に示すように、画像の挿入と参照ができます。

\end{document}
2. tabular環境による表の基本
表は、横の並びを「行」、縦の並びを「列」といいます。 表を作成するには、データを\begin{tabular}と\end{tabular}で挟みます。 \begin{tabular}の後には列の指定(それぞれの列の揃え方)を波括弧内に記載します。 データは&で区切ります。それぞれの行の終了箇所に強制改行「\\」の記号を入れます。 その行の下に横線を引く場合は\hlineを指定します。
基本的な表の作成
\documentclass[uplatex]{jsarticle}
\usepackage[utf8]{inputenc}
\usepackage{amsmath,amssymb}
\usepackage[dvipdfmx]{graphicx}
\begin{document}
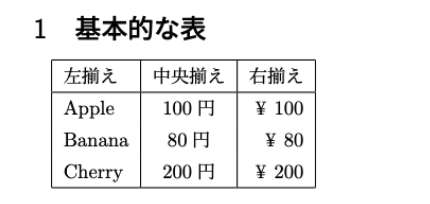
\section{基本的な表}
\begin{tabular}{|l|c|r|}
\hline
左揃え & 中央揃え & 右揃え \\
\hline
Apple & 100円 & ¥100 \\
Banana & 80円 & ¥80 \\
Cherry & 200円 & ¥200 \\
\hline
\end{tabular}
\end{document}
tabular環境の構文
基本構文:
\begin{tabular}{列の指定}
行1の内容 & 行1の内容 & 行1の内容 \\
行2の内容 & 行2の内容 & 行2の内容 \\
\end{tabular}
列の指定:
l:左揃え(left)c:中央揃え(center)r:右揃え(right)|:縦線p{幅}:指定幅で左揃え
行内の要素:
&:列(データ)の区切り\\:行の区切り\hline:横線
3. より詳細な表の設定
様々な列指定の例
\documentclass[uplatex]{jsarticle}
\usepackage[utf8]{inputenc}
\usepackage{amsmath,amssymb}
\usepackage[dvipdfmx]{graphicx}
\begin{document}
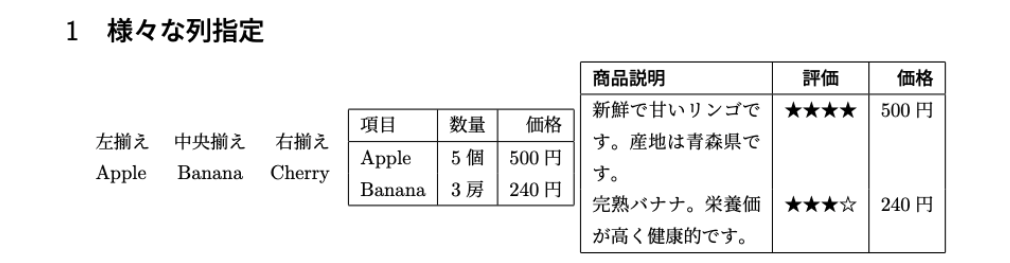
\section{様々な列指定}
% 基本的な配置
\begin{tabular}{lcr}
左揃え & 中央揃え & 右揃え \\
Apple & Banana & Cherry \\
\end{tabular}
\vspace{1cm}
% 縦線付き
\begin{tabular}{|l|c|r|}
\hline
項目 & 数量 & 価格 \\
\hline
Apple & 5個 & 500円 \\
Banana & 3房 & 240円 \\
\hline
\end{tabular}
\vspace{1cm}
% 幅指定
\begin{tabular}{|p{3cm}|c|r|}
\hline
\textbf{商品説明} & \textbf{評価} & \textbf{価格} \\
\hline
新鮮で甘いリンゴです。産地は青森県です。 & ★★★★ & 500円 \\
完熟バナナ。栄養価が高く健康的です。 & ★★★☆ & 240円 \\
\hline
\end{tabular}
\end{document}
4. table環境による表の管理
学術論文では複数の表が用いられます。それぞれの表に番号を自動で割り当てることができます。それぞれの表に\labelをつけて、本文中で\refを使って\labelを参照することで当該の表の番号を呼び出すことができます。また、表の説明のためのキャプションを付けることができます。
キャプション付きの表
\documentclass[uplatex]{jsarticle}
\usepackage[utf8]{inputenc}
\usepackage{amsmath,amssymb}
\usepackage[dvipdfmx]{graphicx}
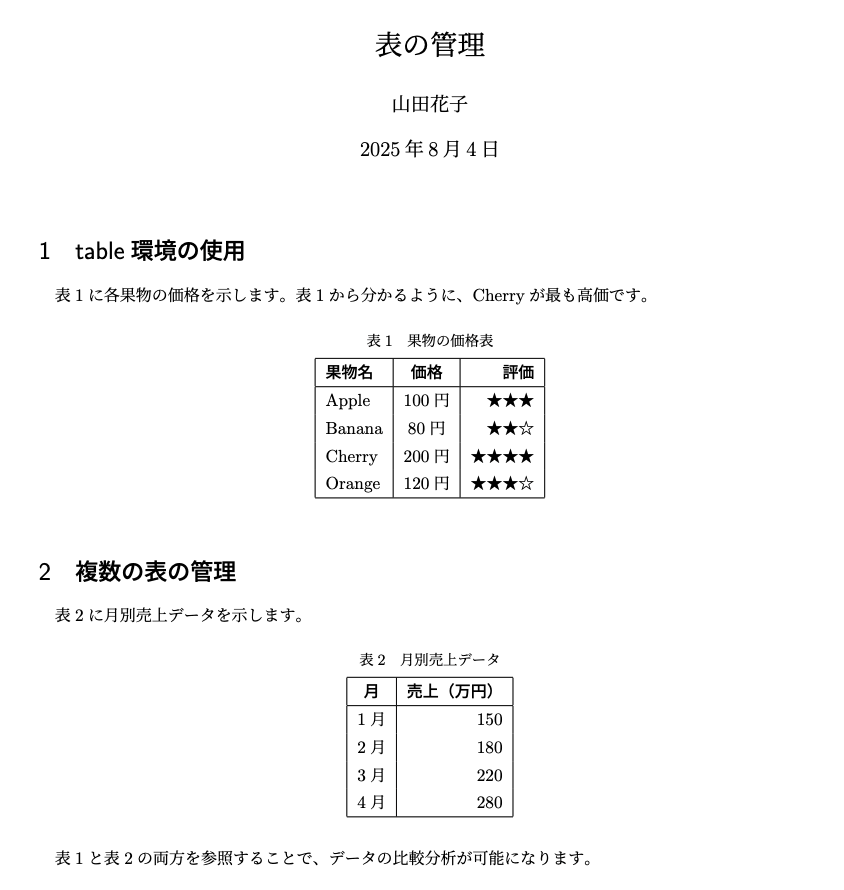
\title{表の管理}
\author{山田花子}
\date{\today}
\begin{document}
\maketitle
\section{table環境の使用}
表\ref{tab:fruits}に各果物の価格を示します。
\begin{table}[h]
\centering
\caption{果物の価格表}
\label{tab:fruits}
\begin{tabular}{|l|c|r|}
\hline
\textbf{果物名} & \textbf{価格} & \textbf{評価} \\
\hline
Apple & 100円 & ★★★ \\
Banana & 80円 & ★★☆ \\
Cherry & 200円 & ★★★★ \\
Orange & 120円 & ★★★☆ \\
\hline
\end{tabular}
\end{table}
表\ref{tab:fruits}から分かるように、Cherryが最も高価です。
\section{複数の表の管理}
表\ref{tab:sales}に月別売上データを示します。
\begin{table}[h]
\centering
\caption{月別売上データ}
\label{tab:sales}
\begin{tabular}{|c|r|}
\hline
\textbf{月} & \textbf{売上(万円)} \\
\hline
1月 & 150 \\
2月 & 180 \\
3月 & 220 \\
4月 & 280 \\
\hline
\end{tabular}
\end{table}
表\ref{tab:fruits}と表\ref{tab:sales}の両方を参照することで、
データの比較分析が可能になります。
\end{document}
table環境の構造
基本構成:
\begin{table}[位置指定]
\centering                    % Center alignment
\caption{表のキャプション}     % Caption
\label{tab:ラベル名}          % Label for reference
\begin{tabular}{列指定}
% 表の内容
\end{tabular}
\end{table}
位置指定オプション:
[h]:ここに配置(here)[t]:ページ上部(top)[b]:ページ下部(bottom)[p]:独立したページ(page)
5. 実践的な表の作成
学術論文スタイルの表
\documentclass[uplatex]{jsarticle}
\usepackage[utf8]{inputenc}
\usepackage{amsmath,amssymb}
\usepackage[dvipdfmx]{graphicx}

\title{物理実験レポート:振り子の周期測定}
\author{山田花子}
\date{\today}

\begin{document}

\maketitle

\section{実験目的}

振り子の周期$T$と長さ$l$の関係を調べ、重力加速度$g$を求める。

\section{実験結果}

表\ref{tab:results}に測定結果を示す。

\begin{table}[h]
\centering
\caption{振り子実験の測定結果}
\label{tab:results}
\begin{tabular}{|c|c|c|c|}
\hline
\textbf{長さ $l$ [m]} & \textbf{周期 $T$ [s]} & \textbf{$T^2$ [s²]} & \textbf{$g$ [m/s²]} \\
\hline
0.25 & 1.00 & 1.00 & 9.87 \\
0.50 & 1.42 & 2.02 & 9.75 \\
0.75 & 1.74 & 3.03 & 9.74 \\
1.00 & 2.01 & 4.04 & 9.70 \\
\hline
\end{tabular}
\end{table}

\section{統計分析}

表\ref{tab:statistics}に統計データを示す。

\begin{table}[h]
\centering
\caption{測定データの統計分析}
\label{tab:statistics}
\begin{tabular}{|l|c|c|}
\hline
\textbf{統計量} & \textbf{値} & \textbf{単位} \\
\hline
平均値 & 9.77 & m/s² \\
標準偏差 & 0.074 & m/s² \\
相対誤差 & 0.31 & \% \\
理論値との差 & 0.03 & m/s² \\
\hline
\end{tabular}
\end{table}

\section{考察}

表\ref{tab:results}より、重力加速度の平均値は$g = 9.77 \, \text{m/s}^2$となった。
表\ref{tab:statistics}の統計分析から、理論値$g = 9.8 \, \text{m/s}^2$との
相対誤差は0.31%であり、実験の精度は十分であると言える。

\section{結論}

振り子実験により重力加速度を精度よく測定できることを確認した。
表\ref{tab:results}と表\ref{tab:statistics}の結果は、
今後の実験の参考になると考えられる。

\end{document}
6. 実習課題
課題:表を含む文書の作成
第2回の宿題で作成したTOKレポートに表を追加してください。(表の内容は各自で評価したものを記載してください。)
追加する表:
表1:3つの主張の比較表
- table環境を使用
- 以下の構成:
| 主張 | 根拠の種類 | 強度 | 信頼度 |
|---|---|---|---|
| 主張1 | 経験的 | 高 | 85% |
| 主張2 | 論理的 | 中 | 70% |
| 主張3 | 直感的 | 高 | 80% |
表2:知識の評価結果
- 以下の構成:
| 評価項目 | 主張1 | 主張2 | 主張3 |
|---|---|---|---|
| 論理的一貫性 | 高 | 中 | 高 |
| 証拠の客観性 | 中 | 高 | 低 |
| 検証可能性 | 高 | 中 | 中 |
文書構成例:
\documentclass[uplatex]{jsarticle}
\usepackage[utf8]{inputenc}
\usepackage{amsmath,amssymb}
\usepackage[dvipdfmx]{graphicx}

\title{TOK: 知識の本質について}
\author{あなたの名前}
\date{\today}

\begin{document}

\maketitle

\section{はじめに}
本レポートでは、TOKで提示した3つの主張について分析する。
表\ref{tab:claims}に各主張の概要を示す。

\section{主張の概要}

\begin{table}[h]
\centering
\caption{3つの主張の比較}
\label{tab:claims}
\begin{tabular}{|l|l|c|c|}
\hline
\textbf{主張} & \textbf{根拠の種類} & \textbf{強度} & \textbf{信頼度} \\
\hline
主張1 & 経験的 & 高 & 85\% \\
主張2 & 論理的 & 中 & 70\% \\
主張3 & 直感的 & 高 & 80\% \\
\hline
\end{tabular}
\end{table}

\section{評価結果}

\begin{table}[h]
\centering
\caption{知識の評価結果}
\label{tab:evaluation}
\begin{tabular}{|l|c|c|c|}
\hline
\textbf{評価項目} & \textbf{主張1} & \textbf{主張2} & \textbf{主張3} \\
\hline
論理的一貫性 & 高 & 中 & 高 \\
証拠の客観性 & 中 & 高 & 低 \\
検証可能性 & 高 & 中 & 中 \\
\hline
\end{tabular}
\end{table}

\section{分析}
表\ref{tab:claims}に示すように...
表\ref{tab:evaluation}の評価結果によると...

\section{結論}
表\ref{tab:claims}と表\ref{tab:evaluation}を総合すると...

\end{document}
8. よくあるエラーと対処法
エラー1:列数が合わない
症状:Extra alignment tab has been changed to \cr 対処法:
- 各行の
&の数が列指定と一致しているか確認 \\で行が正しく終了しているか確認
エラー2:表の参照が未定義
症状:Reference 'tab:sample' on page 1 undefined 対処法:
\label{}と\ref{}のラベル名が一致しているか確認- 2回コンパイルを実行(1回目でラベル作成、2回目で参照解決)
エラー3:表が期待した位置に表示されない
症状:表が文書の最後に移動してしまう 対処法:
- 位置指定オプション
[h]を使用 - 強制配置の場合は
\usepackage{float}と[H]オプション
7. 今日のまとめ
今日学んだこと:
- tabular環境:基本的な表作成
- table環境:表の管理とキャプション
- 列指定:l、c、r、p{幅}、縦線の指定
- 参照システム:
\label{}と\ref{}による表の参照 - 学術論文スタイル:実用的な表作成
次回予告:文書の全体構成(目次作成、ページ設定、ヘッダー・フッター)を学びます。
コメント